Friday, December 23, 2005

Hitchhikers Guide to the Earth

We generally associate places or cities based on what we hear or experience from them…and we tag them as ‘Historical’, ‘Religious’, ‘Peaceful’, ‘Beaches’, ‘Mystical’ ‘fun’ etc…

So why not have a web-based application running on GIS (like google map) where we allow people to ‘tag’ places with their terms…not only that allow them to “Refer” or post in their experiences related to that place or city. Also if we can store user’s choices we can do a ‘Tag match’ or ‘profile match’ (with other users) and throw in suggestions to the user…like as per your liking these are the places you would like…a travel planner should also be a part of the system. People can suggest places to stay or travel also…which can make the system more comprehensive…

Powered by CBIR (content based image retrieval) we can also “find/search” places based on the uploaded image ‘query by example’…with a descriptive search also I hope we can also sort our and suggest places to visit.

As far as business model is concerned there can be a huge scope for advertisements for travel agencies, hotels etc.

Thursday, December 22, 2005

People’s “map” powered by Folksonomy and Web 2.0

I recently went to Bangalore and I boarded an auto rickshaw as asked the driver to take me to ‘IISc’ (Indian Institute of Sciences); to my amazement he didn’t know the place…Strange?? I thought. Later I boarded another auto with the same result. But (with God’s wishes) I got a gentleman who know the place and told the auto driver to take me to “Tata Institute”…ooooh why didn’t you tell me so replied the auto driver…I know that place…

Well I’m sure this was not the first and the last time I have face this problem and I’m sure neither have you…the local and popular NAMES in a city are sometimes quite different from the OFFICIAL one and some times create a communication problem especially to a new tourist/visitor.

That’s the genesis of the idea… “Why not to build a comprehensive People’s Map”

If we can have…Flickr & Delicious why not a Map where people Tag in place with their popular name. The names can be presented as a Tag cloud…or in hierarchy of popularity…may be presented in a drop down on a right click on the official names presented on an online map like Google Map, MSN Map or Yahoo Map…it can be an application that works on top of these applications…or can be integrated with them.

I guess it would be interesting to know and learn about local or popular names of places in a city…or even city…..should I say bangaluru??or bangalore?

Monday, December 19, 2005

Asset (RFID) Tags for Intelligent Buildings

The concept of intelligent buildings has been here for quite some time. So I’m not sure where what I’m thinking has been already implemented or not. I was trying to find a project using ‘RFID’ tags, when stumbled upon the idea that “…if I can get a real time data of people inside a building, I can very well build an Intelligent building…”

I searched the MIGHTY ‘internet’ (which is still controlled by the US)…to find if I can find the range, properties and current extent of RFID technology. Then ‘bingo’…I came to know about asset tags…but yes they are active tags (with battery life of 10 years)…

I came across the web site http://www.aeroscout.com ...its a company which produces Wi-Fi enabled active tags that can be read from a distance of 60 mts inside a building and to about 100 mts outside.

With this kind of technology if I can get a real time data of how many people and where they are inside, then this is what can be done:

Energy Conservation

  • Lighting
    • Lighting controlled by number of inhabitants and their movement.
    • Switch on light where ever needed.
    • Control the Lux of light needed based on work and people.
    • Switch off lights where not needed.
    • Not only lights but other equipments can also be switched off/on based on the need.
  • Air conditioning/Heating
    • Switch off or on system depending on people.
    • A personal cabin can be automatically controlled by his/her preference.
    • The blowers and vents can be controlled depending on where the people are.
    • Auto start by entry into a building. When an employee parks his/her car his/her cabin’s A/C can start so that by the time he/she comes in its cool enough with his/her preference.
  • Backup
    • Backup system for electricity can be provided to specific area , again based on the requirement and number of people.

Security

  • Building access
    • Building access can be provided by authenticating by RFID tag.
  • Public Address System
    • In case of emergency/fire portions which have inhabitants can be specifically/effectively addressed.
  • Fire fighting / Rescue
    • During rescue operation RFID tags can track the number of people traped up in the building.
  • Monitor Assets
    • Assets like machines or equipments can be tagged and monitored.
  • Track personal cars in building parking lots.
  • Even track individuals in huge building premises (though privacy issues are there but there could be a design solution to tackle the problem)
  • Even the tag can be used as a digital key to secure computers, almirahs, shelves, storages, intra-payments etc.

The RFID tag ‘holder’ itself can be designed to perform multiple tasks like it can work like a ‘pen drive’.

But no doubt there will be privacy issues…but I hope we can find a solution to that...

You can ignore...because its just 'an idea'...

cheers :)

New Method for Info Graphics...

While working on an assignment on Data Visualization, we (me, Raina and Medha) came up with a Charles Minardish Graph for a Financial Data which show the flow of money in and out of an organization. You can see the assignment on Raina’s Blog.

It was just an overnight assignment and got finished the next day. But some how this idea of representing the financial data in a FLOW got stuck up in my head. The idea of representing the ‘INs’ (earning) and ‘OUTs’ (spending) in business seemed really sensible.

So I yesterday explored some ideas and came up with a design which can represent the ins, the outs and also the flow…in a holistic way.

I call it ‘Bar-fin charts’ for ‘Bar chart with fins or Bar chart for finance’ ;)

Components:
1) x-axis
2)
y-axis
3)
block – the rectangular block
4)
fins – The arrows that represent Ins and Outs…
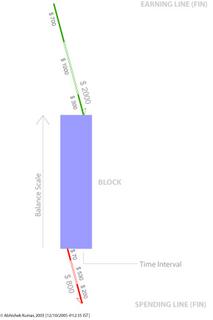
The Dimensions of data that can be represented:

1) Time Interval
2) Total Balance
3) Total Spending
4) Components of Total Spending
5) Total Earning
6) Components of Total Earning
7) Making of financial thresholds.

Time Interval

The time interval is represented by the x-axis of the Block. The financial information is chunked into time intervals (monthly; weekly, quarterly, annually, etc.) so that it becomes easier to notice the comparison.

Total Balance

Total balance is represented by the y-axis of the Block. The division has to be decided based on data.

Total Spending

Total Spending is marked by the LINE (fins) on the lower side and marked by Red color. The line is tilted to 15 degrees from vertical with an Arrow marking to show that amount is being removed from the block. The length of the line marks the value of total spending. The scale of the line should match with the scale by the y-axis of the block. The side which has the arrow will label the Total Spending.

Component of Total Spending

The component is represented by the breakage or makings on Total Spending Line (fin). The values would be marked by the length of the line.

Total Earning

Total Earning is market by the LINE (fin) on the upper side of the block and marked in Green color. The line is tilted to 15 degrees from vertical with an Arrow marking to show that amount is being added to the block. The length of the line marks the value of total spending. The scale of the line should match with the scale by the y-axis of the block. The side which has the arrow will label the Total Earning.

Component of Total Earnings

The component is represented by the breakage or makings on Total Earnings’ Line (fin). The values would be marked by the length of the line.

Making of financial thresholds

In order to make the graph more readable color in the Block can be used to mark the levels in finance. Like – Dark blue for above $300, Blue for $300 to $200, Light Blue for below $200. Grey scales of a color can used to make this parameter.
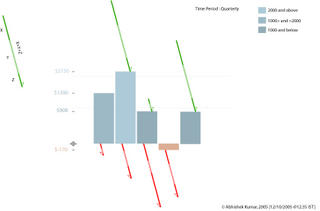

If any of you...ever use this graph...please do let me know...thanks

Gud Day :)

p-Podcast for 'Picture Podcast'

While working on one of my assignment (a system for a Citizen Journalism), I stumbled upon an idea… ‘Why can’t there be a picture podcast?’ a mix of still images changing over an audio…

As you might have read about the latest rumors about Apple launching a video-iPodcast…
(
money.cnn.com/2005/10/05/technology/personaltech/apple.reut/index.htm)
... this picture podcast idea is pretty simple in a way…it’s composition of audio + still images…which change over time based on audio…and this roll over can be automatic or the user uploading this podcast can customize the time of roll over of every image...


The advantage here would that we don’t have to upload and download a video (which has a much larger file size) but upload images which are ‘time tagged’…so an audio is uploaded in audio format but images are uploaded with an addition on time tags…
While downloading images and audio are downloaded; and at the client side these are combined together to make up an Audio-Video file…which can run on windows or real players…or as slide shows...

While playing the images rollover based on the time tags embedded along with the audio…so people will get a multimedia experience...i guess it would be interesting...

Imagine getting audio and images together for an event…may be like ‘London bombing’…viewing the horror by both audio and images…it would be a powerful medium to express and inform…

I'll be posting some of my other thoughts...

Good Day... :)